

By Jorge Sigler
The dairy industry is complex given that it involves major economic stakes. Dairy is an important source of employment and income as well as part of the agricultural economy, which makes it a part of national security concerns. According to the most recent data, the number of operations (milk cows) in the U.S. dramatically declined by 33% between 2001-2009. Despite the plummeting number of operations, dairy production and the number of milk cows have increased; this could point to market consolidation. However, sales of whole milk have seen a steady decline since 1975, as recorded by the USDA (exhibit 1). Sales by pound of whole milk have dropped by almost two thirds, and the trend seems to continue along the same path. The overall sales of fluid milk products have decreased in recent years (exhibit 2), after maintaining steady numbers until 2010, when a downward trend started. The data the USDA presents is by pounds rather than dollars in order to properly portray the industry status. The dairy industry is also volatile with respect to the ratio of feed cost to annual milk production, which has been low for the last decade. Overall, the feed cost to price ratio has been low, mostly due to increased feed cost. The annual milk price fluctuated from $12.18 to $19.21 and, particularly, the 30% decline in prices between 2008 and 2009 accentuated the low milk-feed ratio.

Overall, in 2016 the number of milk cows increased and, since August 2015, milk production increased by 1.9%. Exports of dairy products also increased by 0.4 billion pounds from July to August, mostly in the form of non-fluid milk. However, the trend of consumption is on a downward trajectory, which seems dissonant with the operations and production behavior.
There is great dissonance between the market behavior and milk sales, which leads us to consider one last force that plays a major role and can present a challenge to any company offsetting the dairy industry. Dairy is a much protected sector from a national security perspective and government funds have been allocated in order to save the industry. Two notorious, though not unique, examples follow: 1) the announcement by the USDA of a $20 million cheese purchase on October 11, 2016, as a method to reduce commercial inventories and to aid food banks; 2) a 2009 amendment by senator Bernie Sanders, in which $350 million dollars were assigned to “help” dairy farmers in the state of Vermont. The government’s aid to this sector presents a major challenge to any product seeking to take away market shares.
Public perception of the industry has become increasingly negative for several reasons. Animal welfare activism recordings of the dairy operations have brought to light systematically cruel actions towards the animals and highly unsanitary conditions.
Another factor to take into consideration is the consumer trend towards cruelty-free products. According to a Harris interactive study, about 5% of the U.S. population is vegetarian, with near to half of that identifying as vegan—a way of living that seeks to exclude, as far as is possible and practicable, all forms of exploitation of, and cruelty to, animals for food, clothing, entertainment or any other purpose. The vegetarian/vegan trend is rapidly growing and, if so, it does present a significant threat to the dairy industry.
Better public education on the grading system of milk has generated great image harm. Milk grading is based on somatic cell counts; somatic cells are the white blood cell counts, and white blood cells are generated due to an infection, in most cases caused by mastitis, a well recorded ailment of cows in the dairy industry. Somatic cell count, then, is translated as pus in milk. Current studies have linked milk to several diseases, such as :
- Prostate cancer
- Ovarian cancer
- Multiple sclerosis
- Increased cholesterol
- Type 1 diabetes
Overall, this sector appears to be moribund and, even with governmental aid, the market will ultimately dictate its fate. Major technological breakthroughs that utilize milk may open a way for the industry to flourish or, at least, remain afloat; yet, this is not a safe assumption in favor of the industry. Dairy alternatives that address public concerns—health, nutrition and, however small, cruelty-free foods—may see in the near future a growing market as the dairy industry continues to shrink.
Soy and Almond Milk
Soy and Almond milk production has grown in the last five years, in line with the strong dairy industry decline. There are few players, with one controlling most of the market. Product segmentation of the market is mostly controlled by almond milk (65.5%), followed by declining soy milk (25%) and the rest controlled by rice, coconut and others. The total revenue for this industry is $905.5 million; the annual growth from 2011-2016 has been of 1.3% with a projected growth of 0.5% from 2016-2021.
This sector is driven mainly by the following indexes:
- Healthy eating index (steadily increasing)
- World price of soy beans (although it picked up a couple months ago, it is back on its downward trend, a trend that it has been following for about 5 years)
- Price of nuts (though somewhat more volatile than soy beans, the trend also appears to be downwards)
- Consumer confidence index (slowly growing)
Consumer Online Trends and Behavior
Consumer online trends and behaviors are important since they provides us with a point of reference between the physical data and the consumer’s search interests. In order to obtain the largest pool of information, google/trends was used; this tool analyzes and compiles users’ search information per country and can narrow it down to specific words, related queries and related topics linked to the original search. By using the trends tool from Google, we can better understand the consumers’ interest. Four dimensions are measured in this analysis; the description of these dimensions are extracted verbatim from google/trends:
Interest over time: “Percent values represent search interest relative to the highest point on the chart for the given region and time. A value of 100 is the peak popularity for the term. A value of 50 means that the term is half as popular. Likewise, a score of 0 means the term was less than 1% as popular as the peak.”
Interest by region: “Shows in which location the term was most popular during the specified time frame. Values are calculated on a scale from 0 to 100, where 100 is the location with the most popularity as a fraction of total searches in that location, a value of 50 indicates a location which is half as popular, and a value of 0 indicates a location where the term was less than 1% as popular as the peak.”
Note: A higher value means a higher proportion of all queries, not a higher absolute query count. So a tiny country where 80% of the queries are for ‘bananas’ will get twice the score of a giant country where only 40% of the queries are for ‘bananas’.”
Related topics: “Users searching for your term also searched for these topics. The metric by which they are arranged is ‘Top’ – The most popular topics. Scoring is on a relative scale where a value of 100 is the most commonly searched topic, a value of 50 is a topic searched half as often, and a value of 0 is a topic searched for less than 1% as often as the most popular topic.”
Related queries: “Users searching for your term also searched for these queries. Queries arranged by the metric ‘Top’ – The most popular search queries. Scoring is on a relative scale where a value of 100 is the most commonly searched query, 50 is a query searched half as often, and a value of 0 is a query searched for less than 1% as often as the most popular query.”
The key terms analyzed in the context of consumer trends were:
| · Vegan | · Vegetarian |
| · Milk | · Dairy |
Exhibits 3-6 show the resulting charts. When analyzing those four search elements, the results obtained were:
Vegan: The term’s online relevance remained between 20% and 30% between January 2004 and June 2011. Since 2011 there has been a strong and gradual increase, reaching 93% in May 2016. In interest by region, the U.S. ranks as number 2 with a 94/100 score behind Australia. On the related topics dimension, the number one related topic is “Veganism Diet” with a 100/100 score. The related queries dimension is topped by “Vegan recipes” with 100/100, “Vegan recipe” with 90/100 and “Vegan diet” with 60/100. These numbers all suggest a strong growth of interest in veganism, which is a driver of consumption for dairy replacement products It is important to point out that, on the interest by region dimension, if discriminated by city rather than country, 5 out of the 6 top cities with interest in the term belong to the United States.
Vegetarian: The term online relevance has maintained a steady position between 60% and 75% from 2004 to date, with regular spikes of 85%. On the interest by region dimension, the United States ranks in 6th place with a 43/100 score. For related topics, “vegetarianism” holds the top position with a 100/100 score; and on related queries, “vegetarian recipes” and “recipes” hold a 100/100 score. These numbers also hint at strong interest in the topic. It is important to point out that vegetarians do not necessarily consume dairy replacement products, as many of them still consume cow’s milk.
Milk: The online term has had a steady growth from 66% to 90% since 2004. Interest by region places the United States in the 5th position with a 78/100 score. The top related queries are “breast milk” and “breast,” both with 100/100; however, “coconut milk” and “almond milk” are both present in the 3rd and 5th places with scores of 50/100 and 40/100. The data points that a portion of the interest for the term “milk” is moving towards replacement products.
Dairy: Interest over time for the term “dairy” has fluctuated between 40% and 75% from 2004 to 2013, with several spikes and drops, but since 2009 the drop stands in a higher position and it has increased from 50% to 80%. On interest by region the United States ranks in 4th place with 56/100. On the related topics dimension, the top terms are “Dairy – Industry” with 100/100 and “Dairy Queen – Fast food restaurant” with 95/100. On the related queries dimension, the only relevant one is “Dairy Queen” with 100/100; all terms following that one score 25/100 or below. One important detail worth mentioning is that, on the related topics dimension, if the rising topics are analyzed, we notice a breakthrough (increase above 1000%) on “almond milk – beverage.”
Overall, we can notice a sustained and growing trend towards dairy replacement products. It is quite clear that the market’s demand is shifting from animal’s milk to plant-based alternatives. Our agricultural system and political branches have failed to properly address this trend. It is imperative that our agricultural system transition to align itself with the needs of the consumers in an efficient and timely manner; failing to do so can be very detrimental to the sector and a big part of the economy that is highly dependent on said sector. Further study and analysis are required to understand the implications and financial details of both the animal-based and the plant-based agricultural systems and industries. Consumers are visibly and increasingly shifting to plant-based alternatives; failing to recognize and implement the necessary measures to align our production to the demand can potentially cost taxpayers substantial amounts of money given the core value of the agricultural system within our economy and its interconnected nature with rural development and affordable access to food.
Exhibits
Exhibit1 Whole Milk Sales (dairy milk)

Exhibit2 Total Milk Sales (dairy milk)

Exhibit 3 Search Trend (Vegan)

Exhibit 4 Search Trend (Vegetarian)
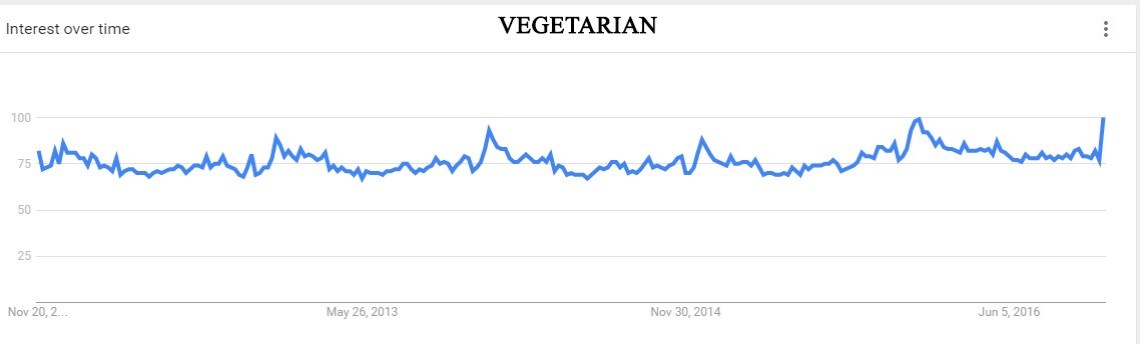
Exhibit 5 Search Trend (Milk)

Exhibit 6 Search Trend (Dairy)

References
- National Agricultural Services (NASS). “Overview of the United States Dairy Industry.” September 22, 2010. Agricultural Statistics Board, USDA. http://usda.mannlib.cornell.edu/usda/current/USDairyIndus/USDairyIndus-09-22-2010.pdf.
- Economic Research Service. “Livestock, Dairy, and Poultry Outlook.” October 18, 2016. USDA. http://www.ers.usda.gov/webdocs/publications/ldpm268/ldpm-268.pdf.
- IBISWORLD Industry report OD4195. “Soy and Almond Milk Production in the U.S.” July 2016. IBISWORLD.
- Lanou, A.J. “Should Dairy Be Recommended as Part of a Healthy Vegetarian Diet?” Counterpoint. The American Journal of Clinical Nutrition 89 (2009): 1638S-42S.
- Dahl-Jorgensen, K., G. Joner and K.F. Hanssen. “Relationship between Cows’ Milk Consumption and Incidence of IDDM in Childhood.” Diabetes Care 14 (1991): 1081-3.
- Malosse, D., H. Perron, A. Sasco and J.M. Seigneurin. “Correlation between Milk and Dairy Product Consumption and Multiple Cclerosis Prevalence: A Worldwide Study.” Neuroepidemiology 11 (1992): 304-12.
- Key, T.J. “Diet, Insulin-like Growth Factor-1 and Cancer Risk.” Proc Nutr Soc 2011: 1-4.
- Kritchevsky, D. “Dietary Protein, Cholesterol and Atherosclerosis: A Review of the Early History.” The Journal of Nutrition 125 (1995): 589S-93S.
- Gardner, C.D., M. Messina, A. Kiazand, J.L. Morris and A.A. Franke. “Effect of Two Types of Soy Milk and Dairy Milk on Plasma Lipids in Hypercholesterolemic Adults: A Randomized Trial.” Journal of the American College of Nutrition 26 (2007: 669-77.
Consumer Online Trends
